A few years ago we provided an outlook as to how many Hispanics used Facebook. Now its important to discuss that the number of Hispanic Facebook users is on the rise, albeit not nearly as fast as for other social channels such as Instagram and Snapchat. It is also very important to note in which language you would want to launch your newly created Facebook page. Choosing between English, Spanish, or Bilingual is a key question when making a Facebook page to establish a business brand. So let’s review how many US Hispanics could potentially sign up as a fan on your brand’s Facebook Page.
How many Hispanics are English or Spanish Dominant?
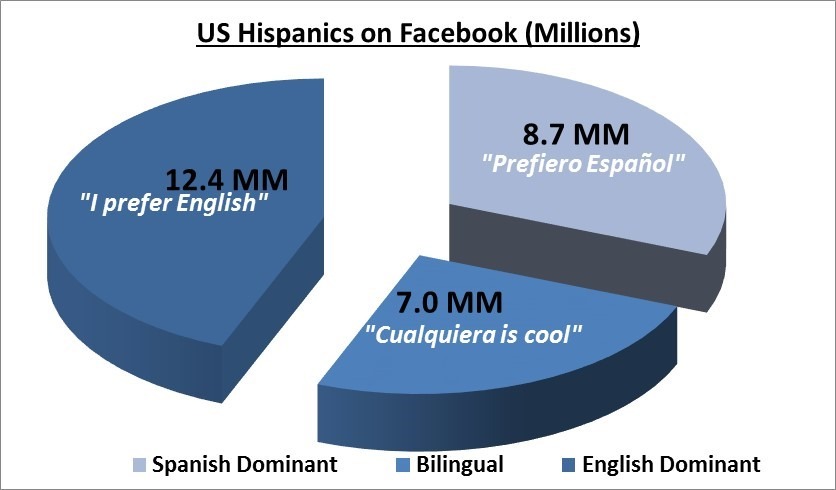
In today’s environment there are 28.03 million US Hispanics on Facebook. Of that amount 31%, or 8.7 million Hispanics, prefer Spanish and would be encouraged to become a fan of a fan page providing Spanish content. A higher number, 12.4 million Hispanics favor English and are more likely to become a fan of a page that is providing stories and media in English. And last but not least, 25% of US Hispanics (7 million) are bilingual and consume content in either language. The graph below sums it up:
What Facebook Pages would these different groups prefer?
Spanish preferring Hispanics would likely gravitate to pages offering daily content in Español such as the Centers for Disease Control (CDC) page. Two other pages catering to Spanish dominants are the AllState Latino Facebook page and State Farm Latino. Hispanics that speak and consume media in English are likely to prefer English language pages catering to US Hispanics preferring English which include the Mexican Word of the Day page as well as the MITU page. A few good Bilingual pages include those of the artist Manu Chao as well as Becky G.
Calculations of Hispanics on Facebook:
1. Total US Hispanic Adults over 18 = 38.4MM based on 2014 US Census estimates.
2.Total US Hispanic Facebook Users = 28.03MM (38.4 * 73%). Based on Pew 2014 Social Media Demographic data.
3. Spanish Dominant US Hispanics = 8.7MM (28MM * 31%). Combines Latin Americans and all Spanish favoring Hispanics in the US.
4. English Dominant US Hispanics = 12.4MM (28MM * 44%). Includes 2nd and 3rd generation Hispanics and all other English favoring Hispanics.
5. Bilingual US Hispanics = 7MM (28MM * 25%). The large portion of Hispanics whom are comfortable with either language.
Note: There are several differing numbers on the language preferences of Hispanics, including those that are referring to Hispanic Online Adults. For the basis of this research we chose to be consistent with the use of Geoscape’s language data. There are valid arguments that can be reviewed on this page which indicate other percentages of Hispanic language dominance.
Thoughts?
How do these figures compare with what you would imagined? What other factors are key when determining the tonality of messaging to the US Hispanic audience? Please place your thoughts in the Comments below.
References:
Pew Internet – Demographics of Key Social Networking Platforms
Nielsen – Hispanics in U.S. Highly Active on Mobile and Social
GeoScape – Percentages of Hispanics preferring English, Spanish, or Bilingual